Pressure Waveforms and Cardiac Output
Take home messages
- When asked to draw a graph, listen carefully to which parameters are on the x and y axis
- Draw and talk at the same time, and practise this lots before the exam
We're clinical physiologists
I challenge you to find another specialty that tinkers with more unfettered raw physiology than anaesthetics.
We pride ourselves on our understanding of physiology, and have been known to reply to other specialties with unapologetically nerdy phrases such as:
- "Well we want to increase stroke volume don't we..."
- "This is all atelectasis and we probably just need to recruit the bases..."
- "You can give metaraminol if you want, but I'd go for a spot of inotropy.."
- "Yeah it's that Monro-Kelly thing isn't it?"
You get the idea.
As with all things in anaesthetics, it's generally a good idea not to overcomplicate where possible, and when it comes to cardiac physiology and understanding the pressure waveforms - take it slow and steady.
- The heart is two pumps in parallel
- The right side is a low pressure, high flow pulmonary system
- The left side is a high pressure (and also high flow) systemic system
- Cardiac output is the rate of blood flow out of the heart, expressed in litres per minute
- The cardiac cycle is everything that happens over the course of a single, complete heartbeat
The first graph you need to know
"Can you draw a graph of the cardiac cycle, highlighting the relevant phases and pressure waveforms?"
This can be a gift of an SOE/OSCE question if you're prepared.
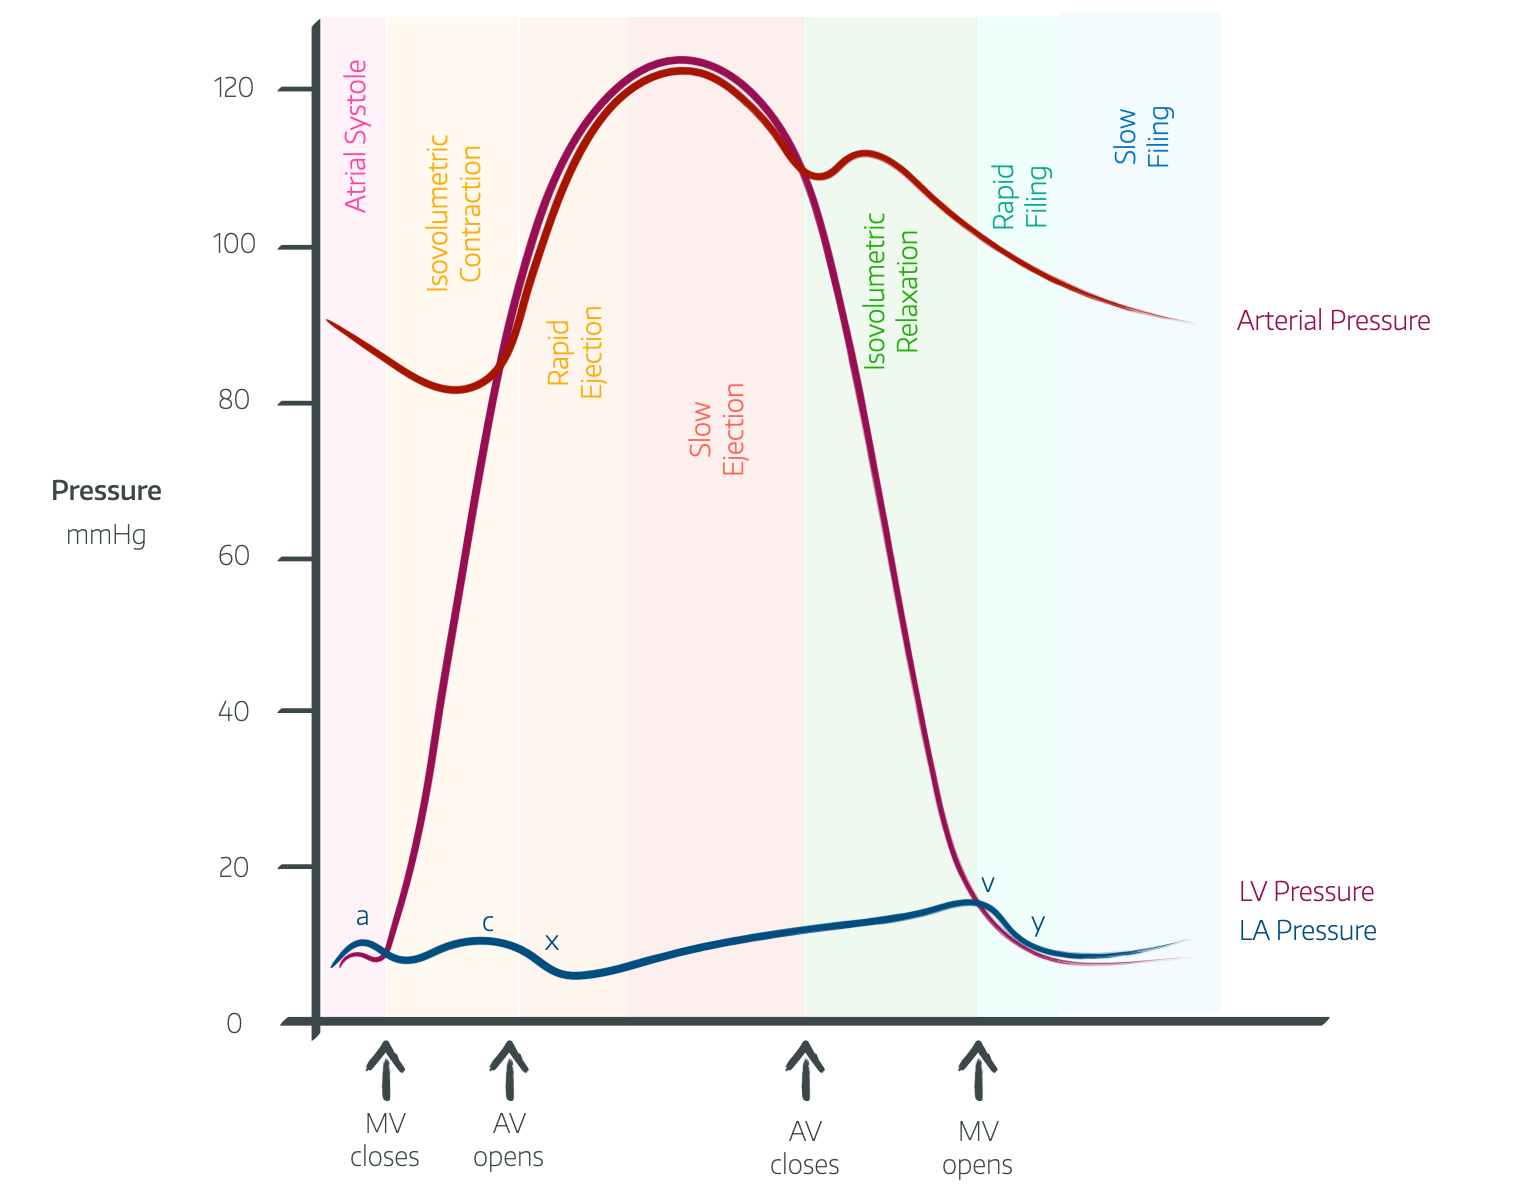
Yeah it's a busy picture - and there's no way round it - you just need to practice drawing it while talking about it until it becomes vaguely comfortable.
The cardiac cycle involves the regular process of relaxation and filling of the heart with blood (diastole), followed by contraction and ejection of blood into the great vessels (systole).
Diastole
To begin with there is isovolumetric (ventricular) relaxation, meaning the pressure in the chamber drops but the volume hasn't yet started to change.
- The start of isovolumetric relaxation is marked by the second heart sound of the aortic and pulmonary valves closing
- The closure of the aortic valve gives a brief rise in aortic pressure known as the dicrotic notch*
- The v wave on the CVP is due to the atria filling against closed tricuspid and mitral valves (they haven't opened yet)
Then we have rapid relaxation and filling
- There is now a pressure gradient between the atria and the relaxed ventricles, leading the atrioventricular valves to open, and blood to flow rapidly into the ventricles, causing the y descent on the JVP
Followed by slow relaxation and filling
- Aortic and pulmonary valves are still closed closed, mitral and tricuspid valves are open
- Low pressure gradient between atria and ventricles results in slow blood flow
- CVP is rising, filling the atria
And finally atrial contraction
- Once atria full, p wave fires triggering atrial contraction
- This gives the a wave on the JVP waveform
- Usually this only accounts for 10-15% of ventricular filling, but during tachycardia this can be up to 30-40%, which is why patients with atrial fibrillation tend to decompensate when they develop a significant tachycardia, as they've lost that vital atrial kick.
Systole
Again we start with a pressure change but initially not a volume change - Isovolumetric contraction
- Ventricles contract and generate higher pressure than in the atria, causing closure of atrio-ventricular valves, (heard as the first heart sound - LUB)
- The pressure continues to increase, causing the AV valves to bulge back into the atria, accounting for the c wave on the central venous pressure wave form
- The pressure finally reaches and exceeds the aortic pressure, causing the aortic valve to open, and blood to eject into the aorta (and the equivalent on the right)
Rapid ejection
- There is initially a large pressure gradient between ventricle and aorta, meaning there is fast flow of blood
- The right ventricle contracts and empties, dragging the right atrium down, and reducing central venous pressure - seen as the x descent
Reduced ejection
- As the ventricle empties, the pressure initially rises more slowly, and then starts to decrease, meanwhile the aortic pressure steadily rises
- Once aortic pressure rises beyond ventricular pressure and the ventricle starts to relax, the aortic valve slams shut, heard as the second heart sound - DUB
The ejection fraction is the proportion of the ventricular end diastolic volume that gets squeezed into the atrium - usually around 60-65%
They might also be really mean and ask you avout the CVP (or JVP) waveform.
Components of CVP waveform
- A wave - end diastole - Atrial contraction
- C wave - early systole - Tricuspid bulge
- V wave - late systole - Systolic filling of atrium
- X descent - mid systole - Atrial relaxation
- Y descent - early diastole - Early ventricular filling
Can you draw and explain the left ventricular volume/time graph?
This is the other weird one they might get you to draw.
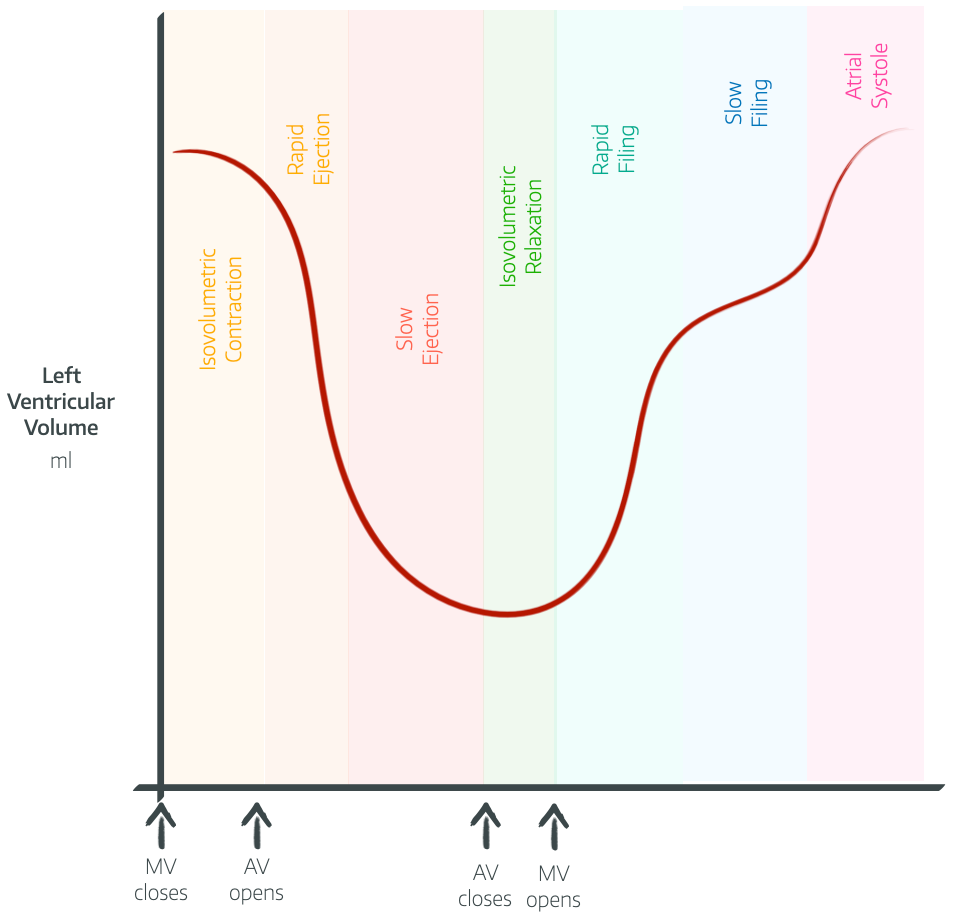
What to say while you're drawing
- Left ventricular volume increases rapidly at the start of diastole, before slowing down
- At the end of ventricular filling the atrial kick provides another 20-30ml
- There is no change in volume during isovolumetric contraction or relaxation
- The max volume is the LVEDV and the minimum is LVESV
- LVEDV - LVESV = stroke volume = approximately 70ml
- SV/LVEDV = Ejection fraction = 60-65%
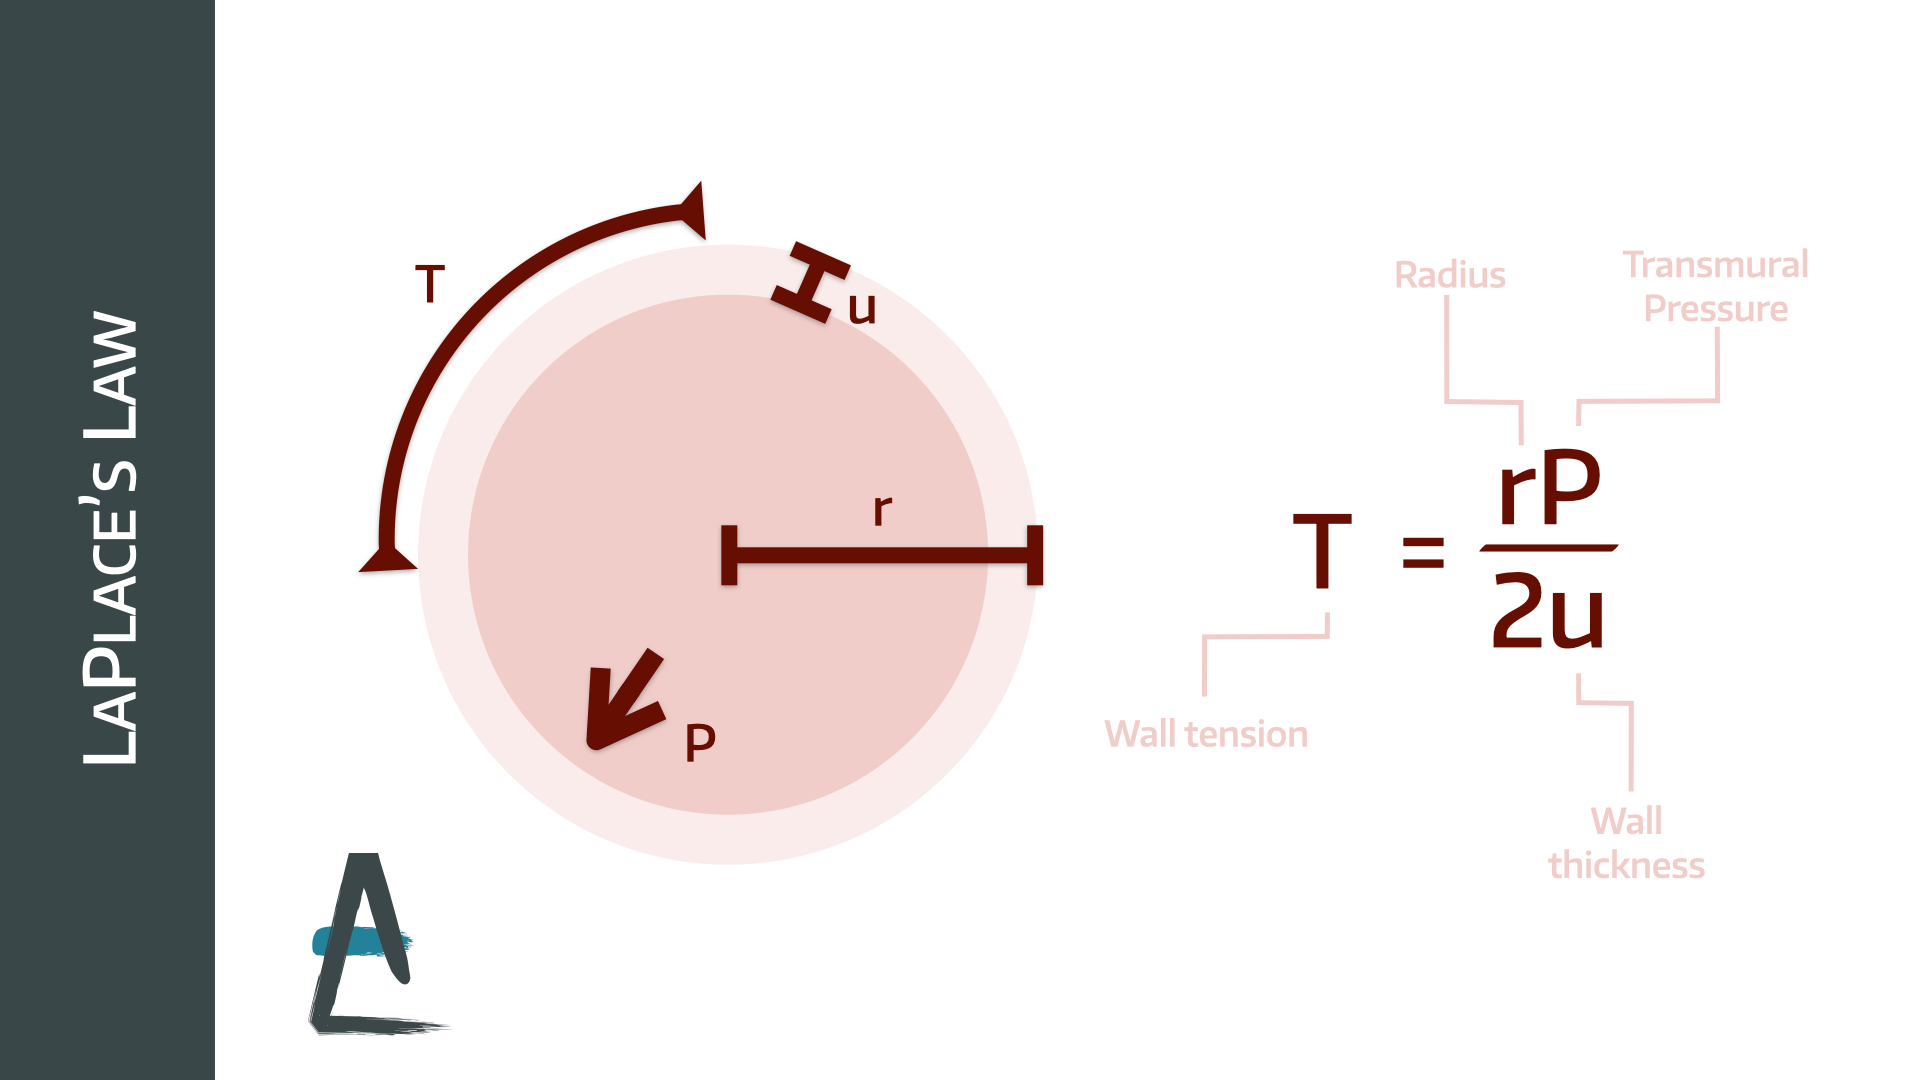
We should probably mention LaPlace's law
The FRCA examiners love an equation, and LaPlace's law is no exception.
As the radius of a vessel increases, or the thickness of the wall decreases, the tension experienced by the wall increases.
This is why dilated bowel is so fragile and the surgeons get seriously worried by a caecum larger than 9cm.
For the heart, it demonstrates how hard a dilated, thin walled, cardiomyopathic heart has to work to squeeze any blood into the aorta - the wall tension that the overstretched myocytes have to overcome is enormous.
Look at this balloon dog's tail

The proximal half of it is fairly well inflated, and the wall tension is squeaky high, but the end of the tail is almost completely flat, with very little wall tension at all, making it all floppy.
The pressure inside each bit is equal (otherwise gas would be flowing from one bit to another)
It is the increased radius that means the pressure is exerting a much higher wall tension across the proximal part than the distal section.
That's probably enough of that for now.
Can you explain the Frank-Starling mechanism in relation to the heart?
The Frank-Starling mechanism, or Starling’s law refers to the ability of the heart to adjust the force of contraction in response to changes in preload
- Increased preload causes stretching of the sarcomeres, and increases the number of overlapping actin and myosin binding sites
- It also sensitises the myocardium to calcium
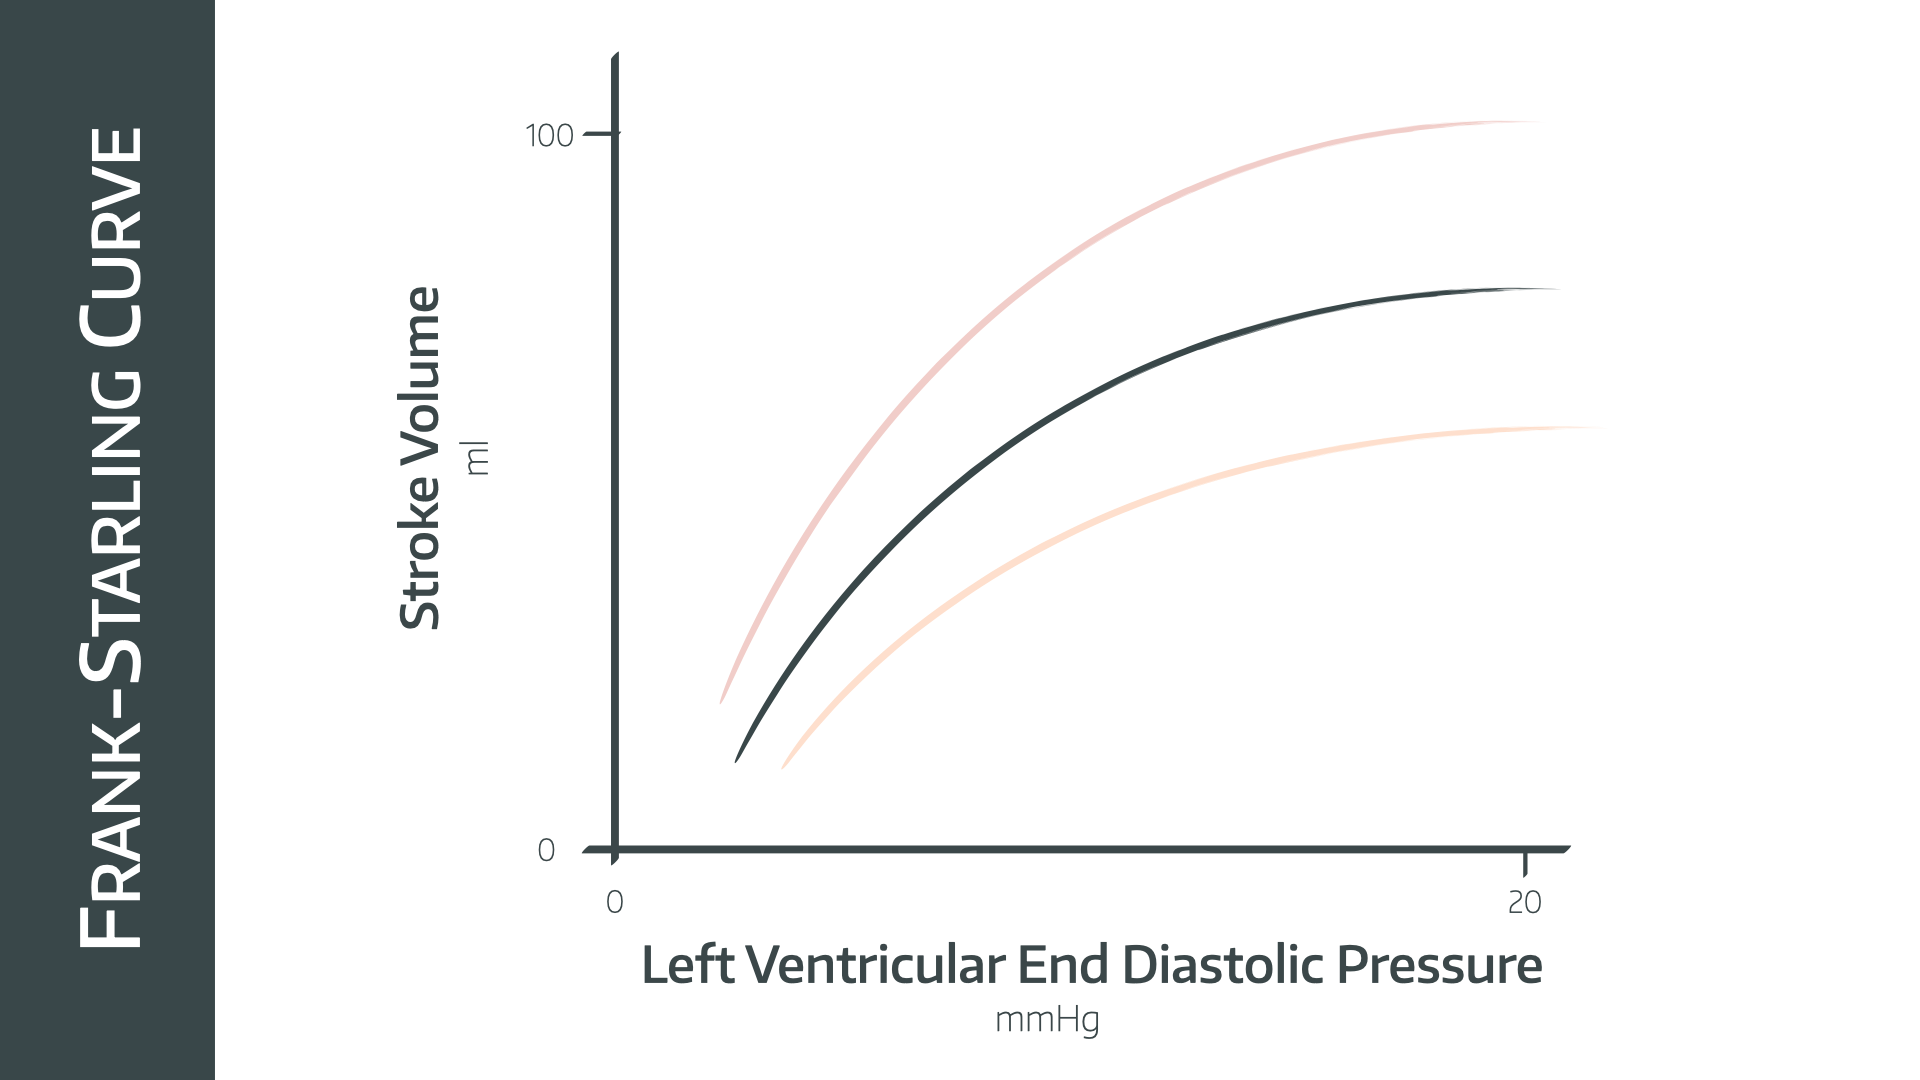
- As demonstrated on the graph, increasing preload causing the stroke volume to increase in a linear fashion until a plateau is reached
- Positive inotropy shifts the curve to the left
- Negative inotropy shifts it to the right
What does this graph look like in heart failure?
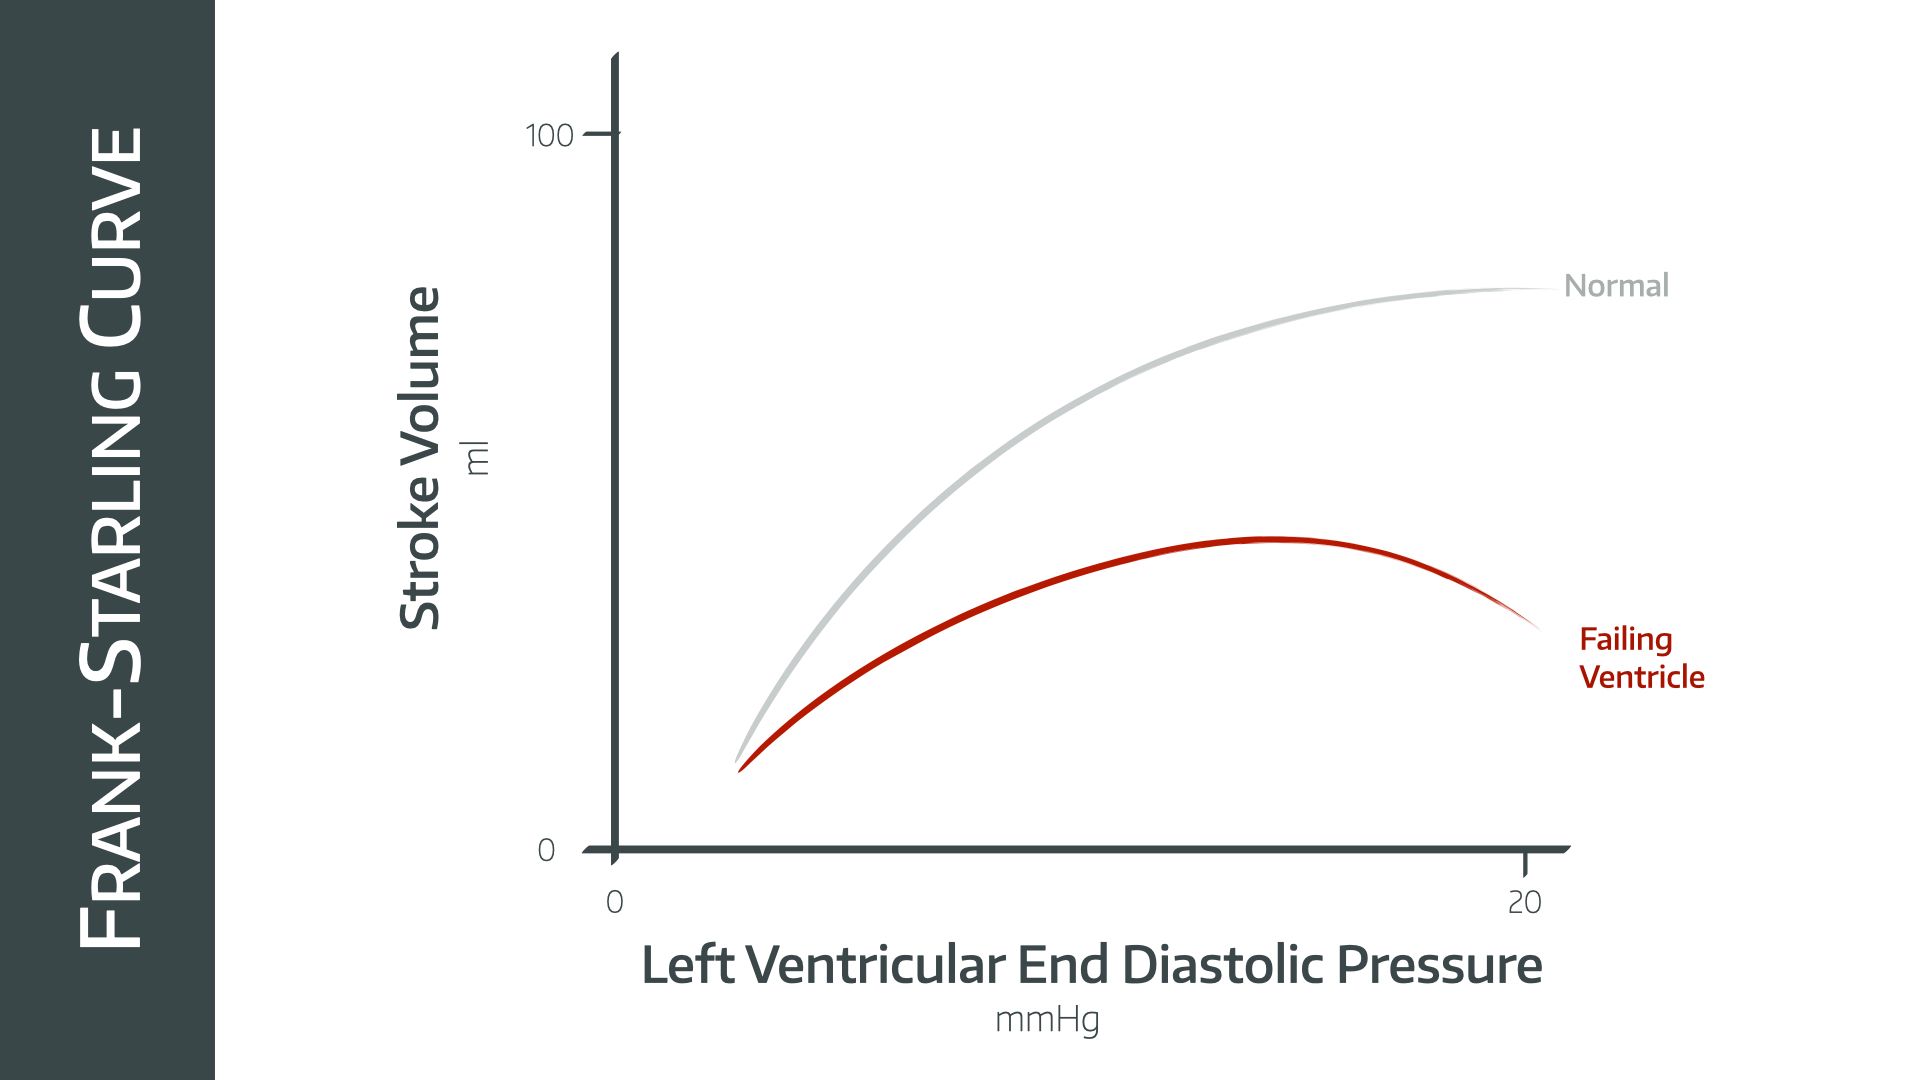
- The graph is shifted to the left and significantly flattened, reducing the maximal attainable stroke volume
- The graph also does not plateau as normal, rather increasing ventricular filling causing a decrease in stroke volume, as is classically seen in congestive heart failure
- This is because the myocardial sarcomeres are now overdistended, reducing the number of overlapping myosin and actin binding sites and therefore reducing the force of contraction
- This distension is usually a chronic problem, because the stiff pericardium usually prevents the heart from overfilling, however over time will distend itself and allow overdistension to occur
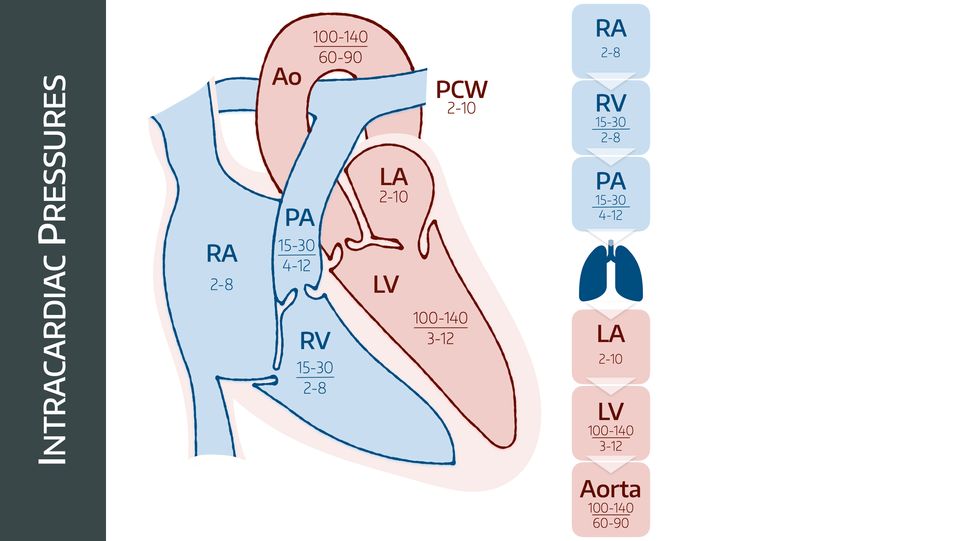
What pressures do I need to know?
Mainly the ones in this image.
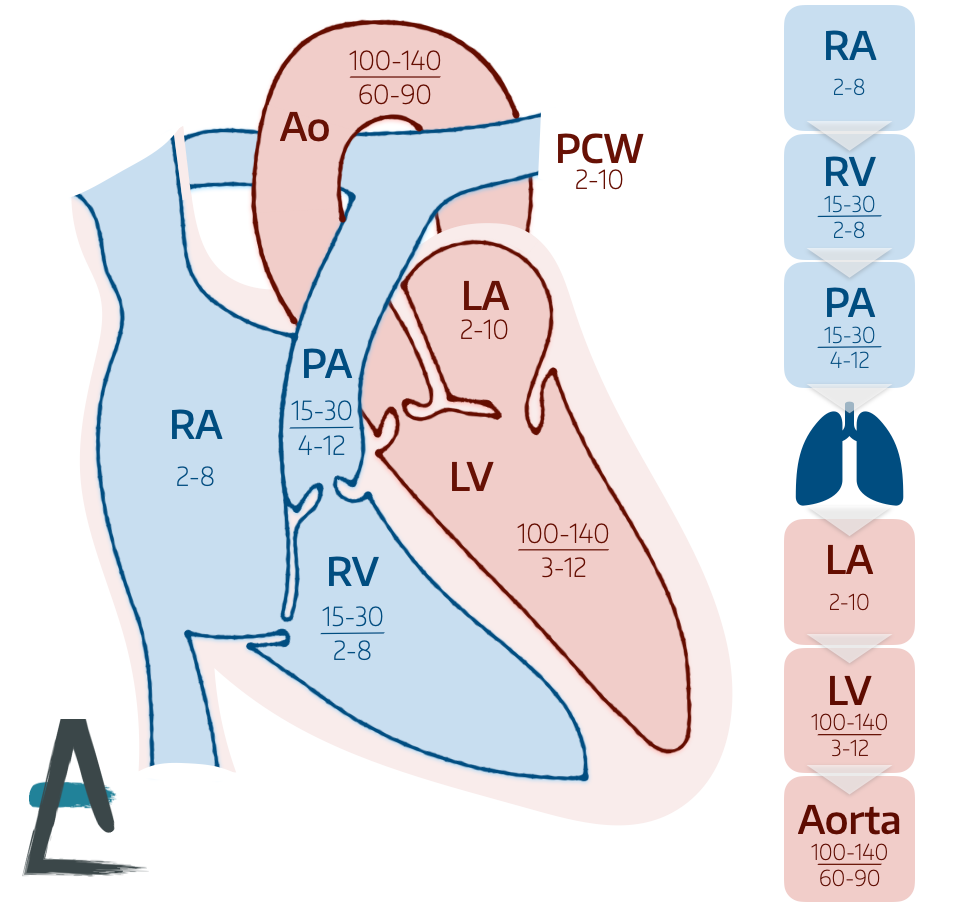
You don't necessarily need to be able to reproduce this image in major detail, but you need to be able to suggest sensible numbers for each of the relevant chambers and major blood vessels, especially if the examiner starts talking about a pulmonary artery catheter.
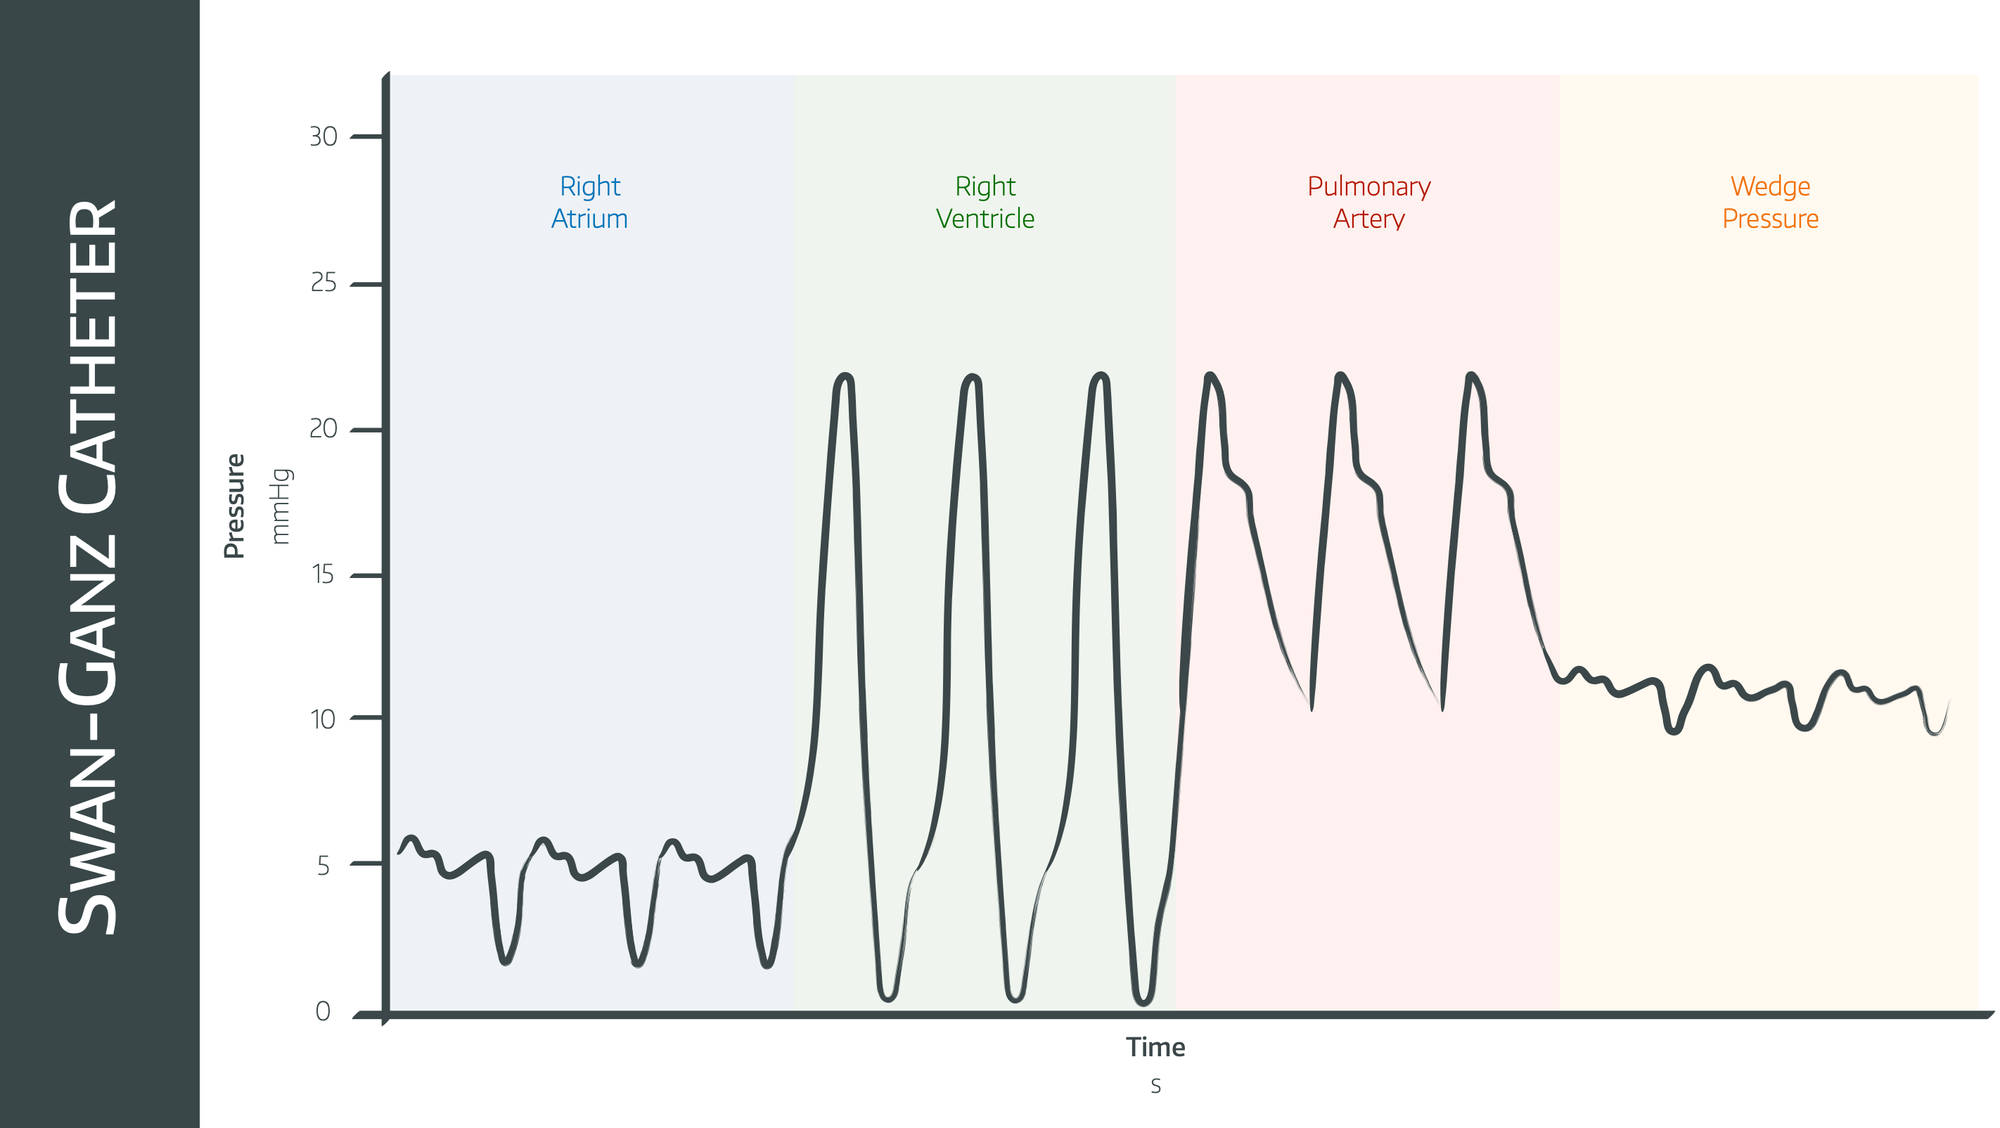
This gets examined a lot given we don't really use PA catheters all that much any more - they're particularly keen on the old 'here are the pressures, where is the tip of the catheter' style MCQ questions.
Syllabus
- PB_BK_38 Cardiac muscle contraction
- PB_BK_39 The cardiac cycle: pressure volume relationships, work and power
- PB_BK_40 Rhythmicity of the heart; cardiac impulse generation
- PB_BK_41 Regulation of cardiac function; general and cellular
- PB_BK_42 Control of cardiac output [including Starling relationship]
- PB_BK_43 Fluid challenge and heart failure, types of shock
- PC_BK_83 Measurement of perfusion: coronary, cerebral, splanchnic, renal
Useful Tweets
Draw the LV pressure waveform during the cardiac cycle. Add the aortic and atrial pressure waveforms. Where does the aortic valve open and close? #FRCA pic.twitter.com/SJBPfENZtr
— Viva Match (@viva_match) October 5, 2018
Summary of cardiac events in the cardiac cycle (ECG corresponding to the CVP waveform in the 2nd pic) 😍
— ميد | MED💉🎓 (@Medical_MD1) June 17, 2021
- pic.twitter.com/M7sed40C7T
References and Further Reading
 Alex Yartsev
Primary FRCA Toolkit
Members receive 60% discount off the FRCA Primary Toolkit. If you have previously purchased a toolkit at full price, please email anaestheasier@gmail.com for a retrospective discount.

Discount is applied as 6 months free membership - please don't hesitate to email Anaestheasier@gmail.com if you have any questions!
Just a quick reminder that all information posted on Anaestheasier.com is for educational purposes only, and it does not constitute medical or clinical advice.